Track your work on the dashboard
The dashboard is the at-a-glance home screen: your pipeline forecast, open requests, callbacks due today, and a feed of recent activity. From this view you can decide what to do next without clicking into each list.
Goal
Open the dashboard, read your key counts, and jump from a dashboard widget straight into the underlying record.
Prerequisites
- You have at least one lead, request, or callback assigned to you (otherwise the widgets are empty).
Steps
1. Open Pipelinq
The dashboard is the default landing page. The Dashboard entry sits at the top of the left navigation. To switch the default to My Work instead, an admin sets the Default landing page option under Manage Pipelinq settings.
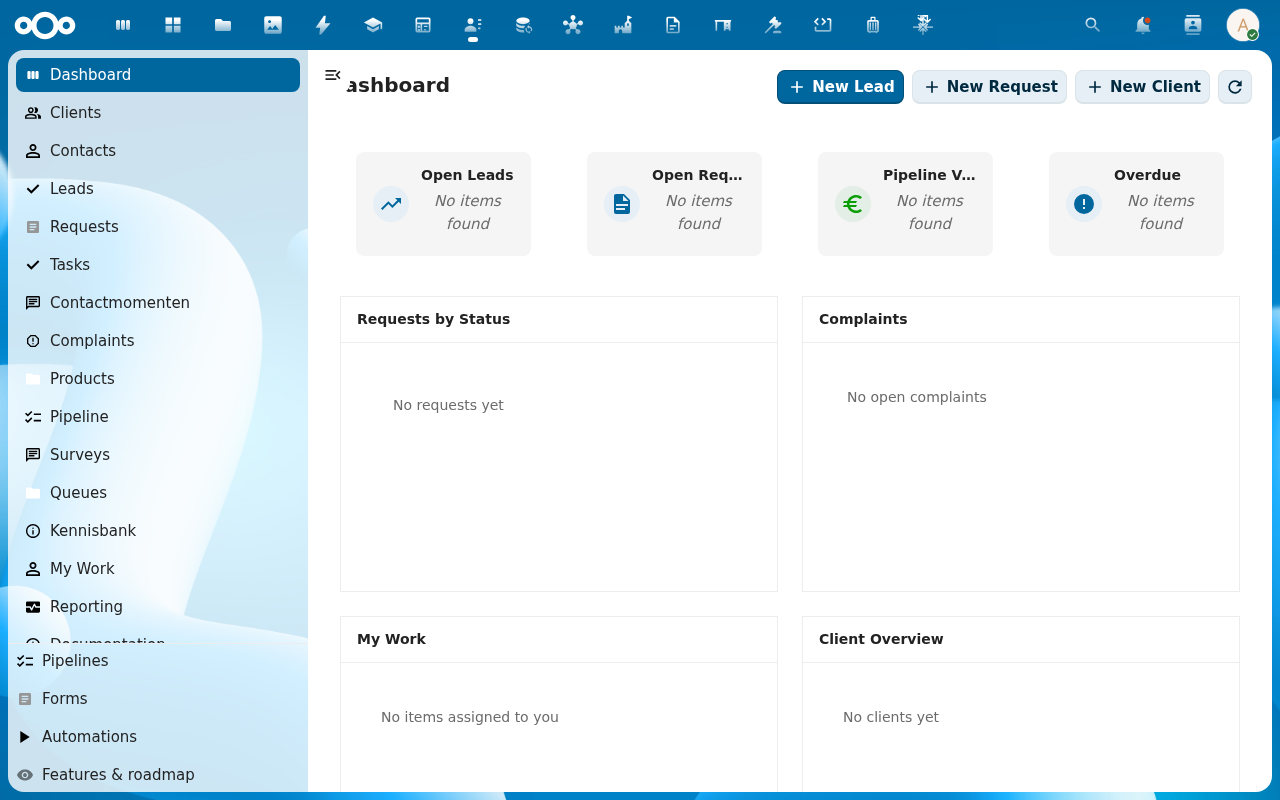
2. Read the headline widgets
- Pipeline: open leads, total value, weighted forecast.
- Requests: open requests in your queue.
- Callbacks today: callbacks due now or overdue.
- Recent activity: the latest contact moments and changes.

3. Filter the view
The filter chips above the widget shelf scope the dashboard by Date range (today / this week / this month / this quarter / custom), Pipeline (one or many), and Owner (Me / My team / Everyone). Filters cascade: each widget reflects the active filter chip set.
4. Drill into a widget
Click any number or list row to open the matching filtered list (or the record itself).
Verification
- Widget counts match the corresponding lists (Pipeline, Requests, My Work).
- The recent-activity feed shows your latest contact moments first.
- Clicking a widget lands on the right pre-filtered view.
Common issues
| Symptom | Fix |
|---|---|
| Dashboard is empty | Nothing is assigned to you yet, or the filter is set to a date range with no activity. Widen it. |
| Forecast doesn't match the pipeline view | The dashboard caches; reload, or check that both use the same pipeline filter. |